Debugging
Summary: We consider strategies for debugging code and begin our exploration of Eclipse's Java debugger.
The Wonder of Program Bugs
Unfortunately, as much as we would like to, sometimes we write code that is less than perfect. When that happens, we can spend more time trying to figure out what is wrong than we actually spent writing the code itself. In order to make sure our code is working, we have to make sure it has no bugs (or at least as few bugs as possible).
How do we know that code is bug-free? It passes all of our well-designed unit tests. How do we know that code has bugs? It fails to pass a unit test.
How do you avoid bugs? You can never completely avoid bugs. Every programmer makes mistakes, fails to predict certain situations, or misunderstands how a language or library works. But you can still work on strategies that help you avoid bugs in the first place.
- Write your tests first so that you think about the special cases that you may have to handle.
- Use preconditions and postconditions whenever possible. In some cases, you may find it useful to insert “assertions” directly in your code so that (a) you document what you expect at any point and (b) you know where things started to go awry.
- Document each section of a procedure so that you can remember what it's supposed to do when you revisit it at a later time (or so that a colleague who revisits your code knows what you were trying to do).
If your code still ends up failing the tests, what do you do next? Sometimes just walking through the procedure again helps. (A student claims the most valuable lesson he ever got from me was “Explain your code to someone, even your golden retriever”. That is, if you sit down and explain what you're trying to do and how you acheive it, you're likely to find the bug.)
More often, though, you'll need to see what's happening while your code runs, as what's happening is clearly different than what you expect. You may be tempted to insert a bunch of print statements, but you are much better off using a debugger. And, fortunately, Eclipse, like most IDEs, has an integrated debugger.
A Quick Introduction to Debuggers
Debuggers are tools for tracing code to find if there is something wrong and what that something is. More precisely, they give you the opportunity to find out where in your code things start going wrong. How do they achieve this? First, they let you single-step through your code, printing values as you go. They also let you set breakpoints so that your steps can be large. Using a debugger will be more efficient and informative than simply putting a bunch of print statements in your code to trace what is going on.
What capabilities can you expect to find in most debuggers?
- You can determine the value of variables and parameters. In some cases, you will need to explicitly click on a variable (or type a command in a textual debugger). In others, the debugger will print them out automatically.
- You can set breakpoints - locations in the code in which you want to start exploring behavior and values. Once breakpoints are set, you can simply run your program until it hits a breakpoint. In Eclipse you set breakpoints by right-clicking the left sidebar of the bottom left window and selecting . You can also remove breakpoints after you've realized that a particular portion of your code is not at fault for the errors.
- You can single step through a method or function. Once you've reached a breakpoint, you may want to follow control flow by executing one line at a time and checking the state of the system after each step. Single stepping can be useful for some loops.
- You can trace the stack Sometimes, it's difficult to know how you got into the current place in the current procedure. A stack trace gives you the full history of calls (often with parameter values).
- You can watch variables. You can set certain variables whose values are always displayed. In the upper right window you can see all the variables you have declared in a method and check what is happening to them every time the method is called
- In many debuggers, you can also change variables. You may find that a variable has a value other than you expected, and want to explore what happens if it has the right value. You may just want to see what happens if it takes on a different value.
- In many debuggers, you can also alter control flow. For example, when you hit a breakpoint, you can direct the program to call another subroutine next, rather than advance to the next statement.
Why Not Debug with Print Statements?
This list of capabilities may suggest many reasons that debuggers are better than just inserting some print statements. Here are some reasons why debugging with print statements is not the best choice.
- At some point, you'll need to remove those print statements. (Well, if you work with a language with macros, or use a subroutine that checks a global debug flag, you may not have to, but you've still spent time inserting code that is unlikely to be necessary over the lifetime of your program.
- In large programs, particularly large programs with loops you might have hundreds of output lines to check. It's much easier to it is easier to break that output down and focus on a small piece.
- If you change your mind about what you're looking for, you have to change the code and recompile. (So, as you debug, you have to do this many, many time.)
- You can't alter the behavior of the program while it's running (e.g., you can't change a variable or calling order).
- You cannot examine memory contents in real time.
So, why not use a debugger instead?
Using the Eclipse Debugger
You will need to develop you're own debugging strategy. And you can best develop that strategy by exploring what you can do. So let's do an exercise so that you get a feeling of what's happening. (Please don't take the code as representative of what you should write or even of code that we'd write.)
Let's take a look at oddPrint. We want it to print
every String at an odd index in the array. When we run it, though,
it seems to to exactly the opposite. Clearly there is something wrong
with our code and we need to fix it.
    public static void oddPrint(String[] array) {
        int x = 0;
        for (int i = 0; i < array.length; i++) {
            if (x++ % 2 == 0) {
                System.out.println(array[i]);
            } // if
        } // for
    } // oddPrint
We can check what is happening to every variable each time the loop executes by entering Debug mode. To enter Debug mode, either click on the button in the top right corner or, if that is hidden from view, click the box on its left and click . You will be presented with this interface:
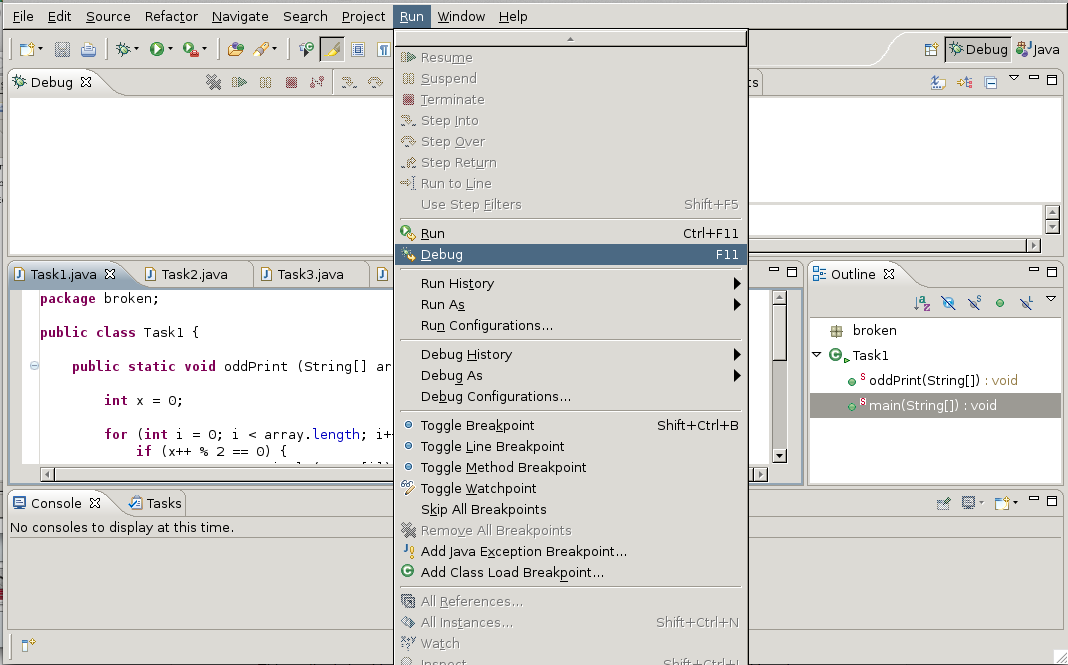 |
Here you can choose the class you want to debug and you run that class in Debug mode by going to > .
We want to check the line in our class that we think is messing up our program and set a Breakpoint there. This means that the debugger will tell us exactly what is happening at that particular line of the code and will not continue to execute the rest of the code unless we tell it to move on. Because we have established the error has to be in the for loop (there is really not much else to the code), we will set our breakpoint on the for loop line. Of course the main method has to be executed as well, since it “runs” the method defined in our class. If we had more methods in our class, the only part of main that would be executed would be the part that pertains to the particular method we are evaluating.
We set a breakpoint by right clicking or double clicking on the right of the class window. In the example the area is separated by a thin line (highlighted yellow in the example below).
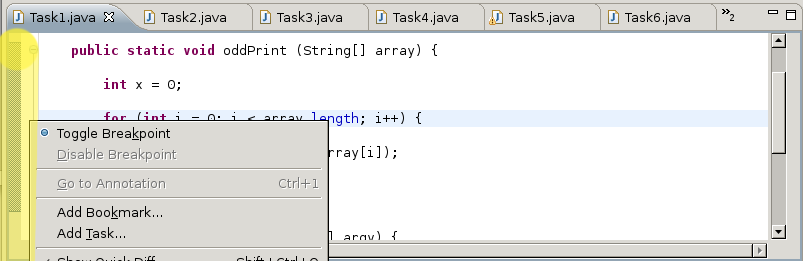
We select .
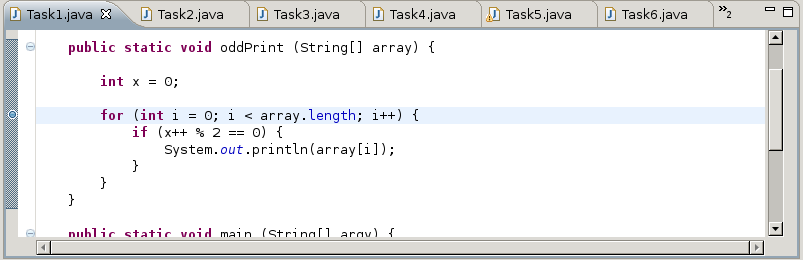
And now we have set our breakpoint at the beginning of the for loop. There is a little blue dot at it. You can also see that the area that will be getting evaluated by the debugger is denoted by a blue line spanning from the method's beginning to the end.
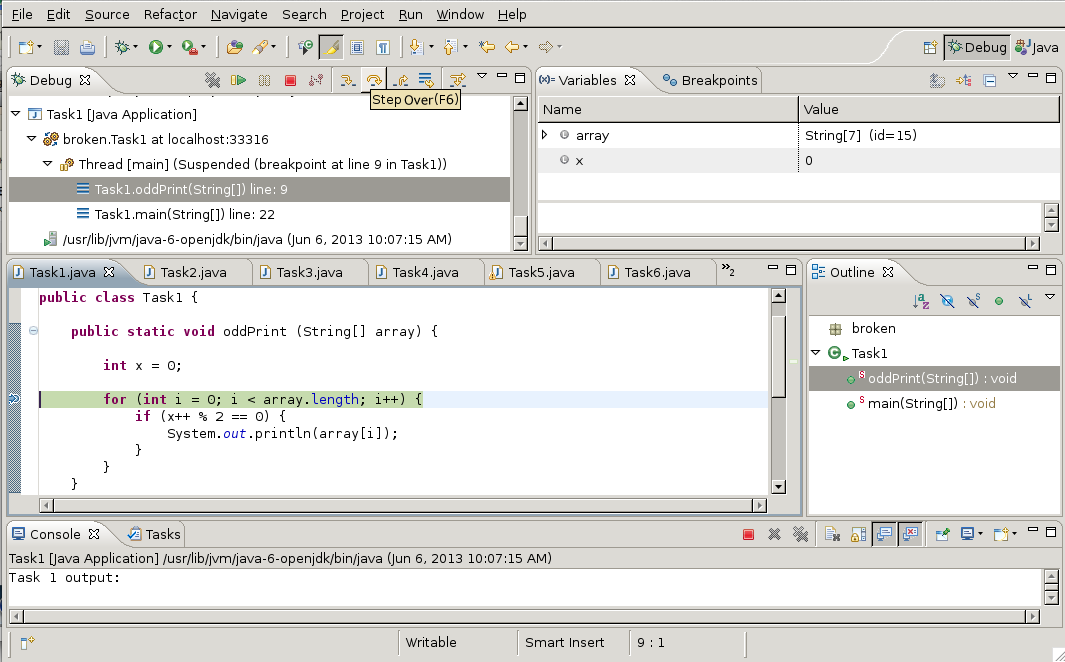
Now we can finally run the code in debugging mode.
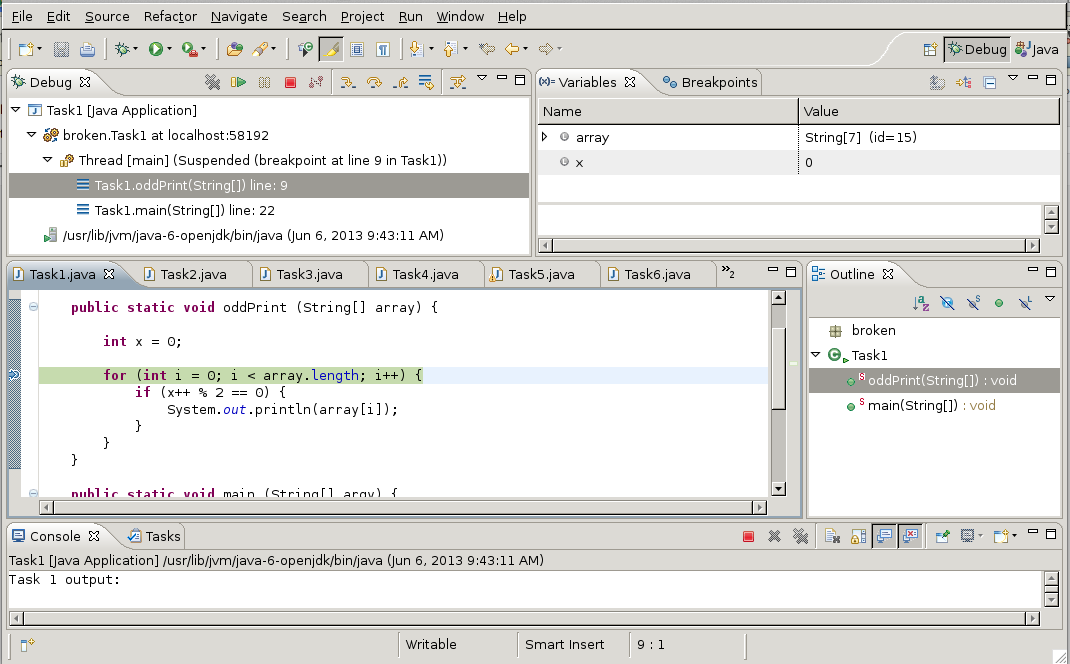 |
A bunch of things happen at once here. The Debug
pane shows us that it is running the code in this class, and that
it starts at line 9 and ends at line 22. The main pane with our class
code shows the line we are evaluating by highlighting it green. The
Variables pane in the top right corner shows
us what's happening to our variables when we run the method with the
values we set in main.
    System.out.println("Task 1 output:");
    String[] numbers = {"zero", "one", "two", "three", "four", "five", "six"};
    oddPrint(numbers);
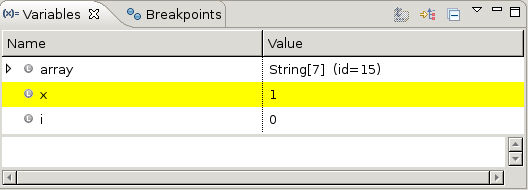
The Variables window is the one that we actually want to watch. We want to see how x and i change with each iteration. Right now it only shows us that x = 0, because we have not executed the first iteration yet. We can do that by “Stepping into” the method.
 |
Stepping over the method moves the debugger down one line - the if statement. We can see the variable i appeared under the Variables tab. Stepping into the method we can track what is happening to both variables. So let's do that a few more times to see what is actually happening and why the method is not working. You can go to Step Over by clicking the button show above or going to > .
There are other ways you could move through the code, such as:
- Step Over moves over the method call, treating it like a single line.
- Step Into moves into the indicated method (the method on the current line).
- Step Out or Step Return executes to the end of the current method call, stopping at the next line of the calling method.
You can see that the variables get highlighted yellow as we go through each line of the loop. This means the variable just changed. We keep stepping over the method and we notice a pattern.
We may notice that x is one more than i
when we enter the for loop.
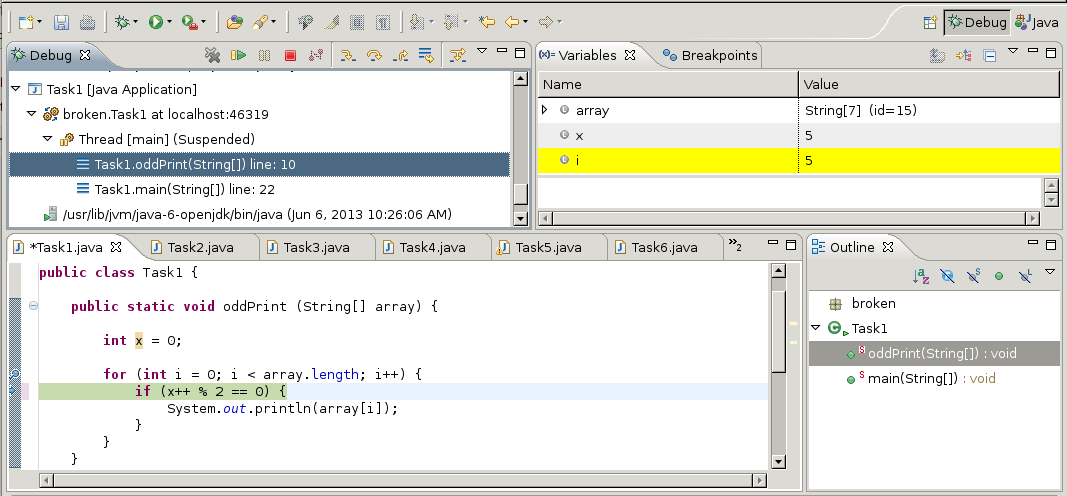 |
When we reach the if statement, x == i. Clearly the method should be implemented in a way where when i is odd, i gets printed. Or in other words, when x is odd, i gets printed.
There are a few ways of how to do fix our code. We could:
-
Change the remainder value:
if (x++ % 2 == 1) -
Use prefix incrementation on x:
if (++x % 2 == 0) -
Or, most sensibly et rid of the x variable completely:
if (i % 2 == 1)
You've now seen a quick debugging session with the Eclipse debugger. Soon you'll have your own opportunity to debug.
Some Final Thoughts
While debuggers are useful, and can help you identify the locations of the errors in your code, they are not a silver bullet. In the end, you will still need to analyze your code for errors, both obvious (well, obvious in retrospect) and subtle.
Some errors can be quite subtle (and infrequent). For example, a debugger is unlikely to help you find the error in the following code. (An error which experienced programmers may be more likely to note.)
   /**
    * Average two integers.  If the average has a fractional portion,
    * may round up or down.
    */
   public static int average(int x, int y) {
       return (x + y) / 2;
   } // average
Wrapping Up
Important Terms
- Debugging
- Debug mode
- Step Into
- Step Over
- Breakpoint
- Stack trace
Review Questions
- List a few times you've had errors in your programs and how you identified the errors. Would a debugger have been useful?
- What are some techniques you use to write less buggy code?
- When your program doesn't work, how can you determine where in the program things are going wrong?