Drawings as Values
This reading has been rewritten for Fall 2015. It is likely to still contain a few typos, errors, and infelicities.
Summary: We introduce a representation of images that we call “drawings”, which can either be some basic shapes or things built from other shapes.
Warning: The procedures discussed in this reading will only work if you connect DrRacket to GIMP using the normal instructions.
Introduction
We've been considering ways to manipulate existing images. But what if we want to make new images from scratch (or perhaps just describe these images). As we've already found, it's often best to start with some simple values and operations on those values.
In thinking about how to describe images, we might consider the basic shapes we (or the computer) are able to draw. For example, we might agree that a unit circle (a circle with diameter 1) is something we can draw, as is a unit square (a square with edge length 1). Why start with those two things? We have to start somewhere.
It might help to visualize these two simple drawings.


In these images, you see the unit circle and unit square (respectively) superimposed upon a simple grid. The greyish area of the grid represents the part of the coordinate system we normally use (non-negative columns, non-negative rows). The grid and greyish area are there only to provide context; they are not part of the “drawing”.
You can certainly imagine a few other simple things that one might draw.
Suppose we have something that everyone agrees can be drawn, such as the unit circle. Could we draw the same thing in a different color? It seems likely. That's why we have crayons! Can we draw a bigger or smaller version of the same thing? It seems like we should be able to do so.
To help us discuss these things, let's call something that can be drawn a “drawing”. So far, we know that
- A black unit circle is a drawing.
- A black unit square is a drawing.
- A recolored drawing is also a drawing.
- A scaled drawing is also a drawing.
For example, a blue unit square is drawing, as is a unit circle scaled by a factor of 5. (The rendering intentionally cuts off part of the scaled circle , because it is so far outside of the normal image area.)


Is a red circle of diameter 4 centered at (0,0) a drawing? Yes. We can start with a unit circle centered at (0,0) and scale it by 4. That new unit circle is still a drawing, so if we recolor it red it is still a drawing.
If we rely on the four definitions above, is a purple circle of diameter 4 centered at (2,3) a drawing? How about a green oval centered at (0,0)? In each case of these cases, we probably have to say “No”, because we can't build either thing if we start with the basic shapes (unit circle, unit square) and using the two operations mentioned above (recolor, scale).
At this point, you may be asking yourself, “Why are we going into such detail about these simple drawings?” You may also be asking yourself, “Why aren't things that are obviously easy to draw, like the purple circle and green oval, considered drawings?”
We are going into this detail because it's a common practice in
computer science (and in many other related disciplines, such as
mathematics) to formally specify the kinds of data you work with.
That is, in formalizing a group of values, we often specify some basic
values (such as squares and circles) and then ways they modify those
basic values to create new values (recolor, scale). Our mathematician
friends often describe the natural numbers (the non-negative integers)
in a similar way: “Zero is a natural number. If you add one to
a natural number, you get a natural number.” We've done
something similar with colors. “Something you create with
irgbirgb-redderirgb-bluerirgb-greenerirgb-lighterirgb-darkerirgb-complement
There are many benefits to such formal definitions, some of which we will explore in this course. One natural benefit is it helps to ensure that everyone talking about a kind of data agrees about the form of those data.
So, why are purple circles (not centered at (0,0)) and green ovals not drawings, even though they are obviously easy to draw? Because our definition does not currently admit them. The inability to specify these natural drawings may suggest a flaw in our definition. Of course, it may also suggest a difference of opinion on what is easy to draw. (Many people can draw squares and circles on graph paper, particularly if given a straight edge and a compass. Fewer can draw ellipses and ovals.)
Since our definition is still relatively simple, let's think of ways to extend it. Our preliminary of those questions dealt with a single drawing. Suppose we had two (or more) drawings and superimposed them. Would the result be a drawing? (Looking at it another way, if someone can draw each of two separate things, can they draw one and then the other on the same sheet of paper?) Yes, it seems so.
- If D1 is a drawing and D2 is a drawing, then the superimposition of D2 over D1 is a drawing, as is the superimposition of D1 over D2.
You may be able to think of other ways we can decide whether we can draw something. For example, if we can draw something centered at one position, we can probably draw it at another position.
However, computer scientists (and some mathematicians) often find it useful to describe things in this way.
In the remainder of this reading, we'll consider how we might describe
drawings using a similar technique, using Scheme to formalize the
values and operations. That is, we'll start with some basic drawing
values and provide operations that build new drawings from old.
In particular, we'll design a drawing data type.
(For now, the implementation of the procedures on this data type will
be concealed. As the semester progresses, we'll think about ways to
implement those procedures.)
Basic Values
For our initial exploration of drawings as values, we'll start with two simple drawing values: the unit circle (diameter 1) and the unit square (side length 1), both centered at (0,0), and drawn in black. Why start with these two values? They're easy to think about, easy to draw, and relatively straightforward to think about.
In Scheme, we'll represent these two values as
drawing-unit-circle and
drawing-unit-square. Note, these are
values, not procedures. That is, you will
not place them immediately after an open parenthesis. Rather, you will
use them in various procedures that take drawings as parameters.
drawing-unit-circle
drawing-unit-square
Could we have other basic values in addition to the unit circle and the unit square? Certainly. We might want lines, other kinds of polygons, more complex curves, and so on and so forth. However, for now, our exercises in design will involve only variations of these two values.
Scaling Drawings
If all that we can draw are the unit circle and unit square, and can only
draw them in one position, we're in a bit of trouble. So let's think
of how we might vary them. Well ... both are fairly small, so we might
want to scale them. Hence, we should provide
procedures that scale drawings. (They will scale the two basic drawings,
but as we come up with other drawings, it will scale those, too.)
One basic version of the procedure will be called (, and, given
a drawing, will return a scaled version of the drawing.
scale-drawing
factor drawing)
When we scale the unit circle by 5, we can envision getting something like
(scale-drawing 5 drawing-unit-circle)
Very important: Note that scale-drawing
To mix things up a bit, let's say that in addition to scaling drawings
in both directions (horizontally and vertically),
we can also scale them in a single direction (horizontally
or vertically). We'll call the procedures
to do so hscale-drawing and
vscale-drawing.

(hscale-drawing 6 drawing-unit-circle)

(vscale-drawing 4 drawing-unit-circle)
Shifting Drawings
But we don't just want our images centered at (0,0). Hence,
we should also be able to shift them
around. We'll use (
to shift the drawing to the right (or to the
left, if hshift-drawing
amt drawing)amt is negative)
and ( to
shift the drawing downward (or upward, if vshift-drawing
amt drawing)amt is
negative). Once again, these don't really shift the original drawing.
Rather, they make new copies of the drawing.
We can envision shifting our unit circle right, left, up, or down.

(hshift-drawing 1 drawing-unit-circle)

(hshift-drawing 2 drawing-unit-circle)

(hshift-drawing 0.5 drawing-unit-circle)

(hshift-drawing -0.5 drawing-unit-circle)

(vshift-drawing -0.25 drawing-unit-circle)

(vshift-drawing 1.5 drawing-unit-circle)
We can also work with previously-created drawings. Suppose we've
defined circ with
(define circ (scale-drawing 5 drawing-unit-circle))
We can then build variants centered at (4,0) and at (0,3).
(define circ-right (hshift-drawing 4 circ))
(define circ-down (vshift-drawing 3 circ))

circ

circ-right

circ-down
Note that the images suggest that the first call
to hshift-drawing on circ
does not affect the position of big-circ. (Otherwise,
circ-down would have been both horizontally and
vertically shifted.) Once a drawing is centered at (0,0),
it is forever centered at (0,0). To get a similar image
in another place, we must shift it.
Putting It Together
By combining the operations we've seen so far, we can now describe drawings that consists of a single black square, a single black rectangle, a single black circle, or a single black ellipse that falls anywhere on the canvas. How do we get rectangles and ellipses? By using different horizontal and vertical scales. For example, a black ellipse of width 5 and height 3, centered at (2,1) can be built from the unit circle as follows:
>(define sample-ellipse (vshift-drawing 1 (hshift-drawing 2 (vscale-drawing 3 (hscale-drawing 5 drawing-unit-circle)))))

sample-ellipse
Yes, that code is a bit long. However, one of the intellectual challenges of algorithm design (and of programming) is finding creative ways to use the basic operations you've been given. A consequence is that you'll sometimes write long code. And, as you've seen, if you find you're regularly writing similar long code, you can always write a procedure to encapsulate it.
You'll also note that we put a lot of carriage returns in that code. Without the carriage returns, the code gets fairly “wide”, which makes it a bit less readable, particularly if your Scheme window is not very wide.
> (define sample-ellipse
    (vshift-drawing
     1
     (hshift-drawing
      2
      (vscale-drawing
       3
       (hscale-drawing
        5
        drawing-unit-circle)))))
Making Drawings More Lively: Adding Color
Although we can describe a variety of drawings, the drawings we
can describe are still black. Let's make them a bit more lively.
In particular, let's add a procedure that recolors drawings.
(That is, makes a copy of the drawing in another color.) We'll
call that procedure (.
recolor-drawing
newcolor drawing)
Our ellipse, recolored in purple, might then be rendered as follows.

(recolor-drawing "purple" sample-ellipse)
Combining Drawings
Our repertoire for describing drawings has expanded significantly.
We've can now describe circles, squares, rectangles, and ellipses
in a variety of colors and at any size and any location. But a
single shape rarely makes a compelling drawing. Hence, we'll
want to combine drawings into new drawings. The procedure
( combines drawings for us.
drawing-group drawing1 drawing2)

(drawing-group circ-right (recolor-drawing "red" circ-down))
Now, here's the another fun part. If we agree that a group of superimposed drawings is also a drawing, then we can do anything to that group that we did to the simpler drawings: We can recolor it, scale it, shift it, and combine it with other groups. Together, those different features will allow us to create some fairly interesting drawings. For example, once we've described a single face, we might make new copies of the face in different colors, at different locations, stretched in various ways, and so on and so forth. You'll explore these capabilities in the corresponding and subsequent labs.
Detour: Pure Operations
As you might guess, one of the reasons we've looked at drawings in terms of operations that build new drawings from old is to encourage you to think in this new way about data. (Just as our mathematician friends think of integers in terms of a basic value and the operation that creates new integers, you can now think of drawings as basic values and operations that create new drawings.)
However, there's another reason that we like this way of describing
drawings: All of the operations are pure: They do
not modify the underlying value they are applied to. Rather they build
new values. Contrast this to the various image operations
you've learned. If you tell GIMP to switch the foreground color,
GIMP's “state” changes, and the old foreground color is lost.
In contrast, if you recolor a drawing, the original drawing is still
in the old color. And maybe that's not surprising. After all, if
you write (irgb-darker fave-color), you don't expect
fave-color to change; you expect to get a new color.
Similarly, if you write (recolor-drawing "red" fave-drawing),
you should not expect fave-drawing to change; you should
expect to get a new drawing.
There are both advantages and disadvantages to working with pure operations, but, like working with a small set of operations, it's a useful intellectual challenge.
By the way, here's one great advantage of working with pure operations: Since the original values are still around somewhere, you never need to undo an action.
Drawings as Scheme Values, Revisited
At the beginning of this reading, we noted that we often specify data types by providing the basic data values and operations that build new values from other values. Let's review the ones that we've come up with.
We have two basic drawing values.
drawing-unit-circleis a drawing. It represents the unit circle (diameter 1, centered at (0,0)).drawing-unit-squareis a drawing. It represents the unit square (edge length 1, centered at (0,0)).
We have a variety of procedures that operate on drawings.
-
If
dfactor(is a drawing that represents a scaled version ofscale-drawingfactord)d -
If
dfactor(is a drawing that represents a horizontally scaled version ofhscale-drawingfactord)d -
If
dfactor(is a drawing that represents a vertically scaled version ofvscale-drawingfactord)d -
If
doffset(is a drawing that representshshift-drawingoffsetd)doffset -
If
doffset(is a drawing that representsvshift-drawingoffsetd)doffset -
If
dc(is a drawing that representsrecolor-drawingcd)cc -
If
d1d2(is a drawing that represents the overlay ofdrawing-groupd1d2)d2overd1.
Designing the Drawing Library
The procedures described above constitute a basic library for describing simple drawings composed of circles, squares, ellipses, and rectangles.
Why don't we have other procedures, such as a procedure to draw
a circle? Because we are trying to keep the set of procedures
minimal. For example, we don't have a procedure to draw a circle
because we already have a way to draw any circle: We start with
the unit circle, recolor it, shift it, and scale it. Would a
drawing-circle
When creating a library, a designer must balance utility, concision
of expression, and size of the library. In this particular case, we've
tried to avoid adding procedures that duplicate existing functionality.
For example, we don't need a
drawing-circlehshift-drawingvshift-drawing
We've chosen this minimal design because of the audience: The procedures are designed for beginning CS students. Since one of our goals for this point in your career is to help you think about combining procedures and about combining procedures, so it makes sense to keep the library small. If we were designing the library for, say, an artist, we would provide a richer library, even if we duplicated functionality.
Rendering Drawings
We now know how to describe drawings. But what
if we want to see the drawings we've described?
The procedure ( will convert a drawing to an
image that we can display. For example, we could show the simplest
circle drawing on a 100x50 canvas with
drawing->image
drawing width
height)
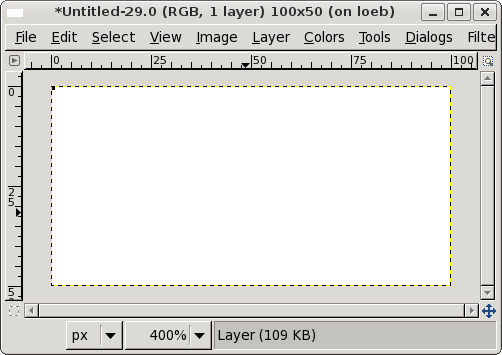
>(image-show (drawing->image drawing-unit-circle 100 50))
Of course, the unit circle is relatively small (diameter 1), so its rendering on the 100x50 canvas is essentially invisible, even when we zoom in.
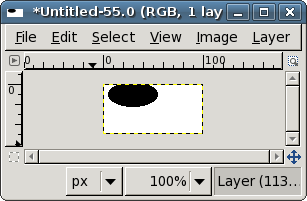
Hence, in practice, we are likely to scale drawings before rendering. Often, we start with larger building blocks, made by scaling the original images. For example, here's a circle with radius of 50.
>(define big-circle (scale-drawing 100 drawing-unit-circle))
We could easily build an image for that circle.
>(image-show (drawing->image big-circle 100 50))
In the GIMP, we would then see something like the following.
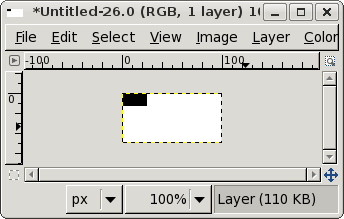
To make a rectangle that is 50 wide and 25 high, we might write
>(define rect (vscale-drawing 25 (hscale-drawing 50 drawing-unit-square)))>(image-show (drawing->image rect 100 50))
We can also shift the big objects we create.
In the following, low-circle will be centered at (0,25)
and right-circle will be centered at (60,0).
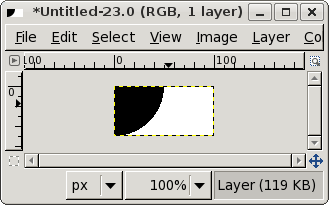
>(define low-circle (vshift-drawing 25 big-circle))>(define right-circle (hshift-drawing 60 big-circle))>(image-show (drawing->image (drawing-group low-circle (recolor-drawing right-circle "red")) 100 100))
We can also build bigger ellipses. For example, here we've built an ellipse of width 50 and height 25, centered at (30,10).
>(define new-ellipse (vshift-drawing 10 (hshift-drawing 30 (vscale-drawing 25 (hscale-drawing 50 drawing-unit-circle)))))>(image-show (drawing->imagenew-ellipse 100 50)
You can also do most of the work at a small scale, and then scale everything just before rendering. In fact, that's how we generated the figures for most of this reading: We built them at the scale suggested by the code, overlaid the drawings on a simple grid, scaled the overlaid drawing, and then rendered it.
Representing Drawings
So, how does MediaScheme represent drawings internally? Usually, you shouldn't be able to tell much about how programs represent their values. However, because of a quirk in the design of MediaScheme, you can see a bit about that representation. Let's see what happens when we just ask for the unit values, but don't display them.
>drawing-unit-circle'(drawing ellipse 0 "" -0.5 -0.5 1 1)>drawing-unit-square'(drawing rectangle 0 "" -0.5 -0.5 1 1)
So, we see
- a single-quotation mark (a.k.a. a tick mark or a minute mark);
- an open parenthesis;
- the word “drawing”;
- either the word “ellipse” or the word “rectangle” (hmmm ... why not “circle” or “square”?);
- a number, which seems to be 0 in both cases;
- a string, which seems to be empty in both cases;
- four more numbers; and
- a close parenthesis.
The parentheses make it look like a procedure call (perhaps to the
procedure drawing). However, in this case, they are
Scheme's way of indicating that the values are grouped in a
list, a simple ordered collection of values.
THe extra single-quotation mark helps us tell the difference.
You don't yet know how to work with lists, but that's okay, because
you're not intended to. It is, however, potentially useful for you
to understand the values in the lists that are used to represent
drawings. You can find that out experimentally.
Let's see what happens when we shift the unit square.
>(hshift-drawing 5 drawing-unit-square)'(drawing rectangle 0 "" 4.5 -0.5 1 1)>(vshift-drawing 3 drawing-unit-square)'(drawing rectangle 0 "" -0.5 2.5 1 1)
Okay, it seems like the first number after the string has something to do with the horizontal position of the square and the second number after the string has something to do with the vertical position. (What particular thing it represents we'll leave as an exercise for the reader.)
Next, let's see what happens when we enlarge the unit circle.
>(hscale-drawing 5 drawing-unit-circle)'(drawing ellipse 0 "" -2.5 -0.5 5 1)>(vscale-drawing 6 drawing-unit-circle)'(drawing ellipse 0 "" -0.5 -3.0 1 6)>(scale-drawing 10 drawing-unit-circle)'(drawing ellipse 0 "" -5.0 -5.0 10 10)
Interesting. Scaling the circle horizontally also affects the value that has to do with the horizontal position, and it also affects the third value after the string. Scaling the circle vertically affects the value that has to do with the vertical position, and also affects the fourth value after the string. In particular, it looks like the third value after the string is the width and the fourth value is the height.
Now, what about that 0 and the empty string? What else can we do with drawings? The only other thing we know how to do is to recolor them, so perhaps one has to do with the color. Let's see ...
>(recolor-drawing "red" drawing-unit-square)'(drawing rectangle 16711680 "" -0.5 -0.5 1 1)>(recolor-drawing "blue" drawing-unit-square)'(drawing rectangle 255 "" -0.5 -0.5 1 1)>(recolor-drawing "purple" drawing-unit-circle)'(drawing ellipse 8388736 "" -0.5 -0.5 1 1)
Okay, that first number seems to represent the color, but using some very strange numbering system that you may have encountered already.
What about that string? Well, it turns out the string is used in procedures that we have not yet taught you, so let's just leave it alone for now.
Why look at these internal issues? One key reason is that it's sometimes easier to understand what the transformations do by looking at the representation, rather than trying to understand the displayed image.
Drawings, Revisited
Let's pause a moment and think about what we can do with these basic values and corresponding procedures. Here are a few simple shapes.
(define black-circle
  (hshift-drawing
   30
   (vshift-drawing
    40
    (scale-drawing 50 drawing-unit-circle))))
(define purple-ellipse
  (vshift-drawing
   10
   (hshift-drawing
    30
    (vscale-drawing
     25
     (hscale-drawing
      50
      (recolor-drawing "purple" drawing-unit-circle))))))
(define blue-i
  (recolor-drawing
   "blue"
   (drawing-group
    (hshift-drawing
     4
     (vshift-drawing
      4
      (scale-drawing 8 drawing-unit-circle)))
    (hshift-drawing
     4
     (vshift-drawing
      28
      (hscale-drawing
       8
       (vscale-drawing 32 drawing-unit-square)))))))
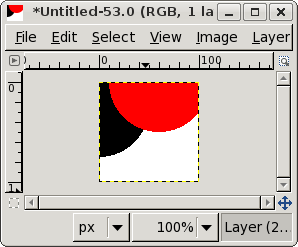
(define red-eye
  (hshift-drawing
   32
   (vshift-drawing
    12
    (drawing-group
     (hscale-drawing
      64
      (vscale-drawing
       24
       (recolor-drawing "darkgrey" drawing-unit-circle)))
     (hscale-drawing
      60
      (vscale-drawing
       20
       (recolor-drawing "white" drawing-unit-circle)))
     (hscale-drawing
      16
      (vscale-drawing
       20
       (recolor-drawing "red" drawing-unit-circle)))))))
Can you guess what they'll look like when rendered? Take a moment to sketch them for yourself. We'll tell you at the end of the next section.
A Problem: Repeated Computations
As you build drawings, you'll see that most interesting drawings more than just one or two procedure calls. For example, to build a black circle of radius 25, centered at 40, 30, we need to
- Scale the unit circle by 50.
- Horizontally shift that circle 40 units to the right.
- Vertically shift that circle 30 units down.
Here's code to do that.
(define black-circle
  (hshift-drawing
   30
   (vshift-drawing
    40
    (scale-drawing 50 drawing-unit-circle))))
More generally, given a radius, an x coordinate, and a y coordinate, we should write a procedure that groups the three together to create a circle.
(define my-circle (lambda (radiusx-centery-center) (hshift-drawingx-center(vshift-drawingy-center(scale-drawing (* 2radius) drawing-unit-circle))))
What would we do if we wanted to color our circles? We could
add another parameter to the procedure to represent the color.
What would we do to draw a rectangle, rather than a circle?
We'd probably replace radiuswidthheight
Sample Drawings
Remember that code from a few sections back that described drawings? Here are the drawings the code described. Did you get them right? If so, good job! If not, think about what you might have misunderstood.

black-circle

purple-ellipse

blue-i

red-eye
Another Problem: Varying Drawings
The my-cirlce
For any of our drawings above, the code is straightforward. For example,
(define black-circle-1
  (hshift-drawing
   15
   (vshift-drawing
    20
    (scale-drawing 1.25 black-circle))))

(define purple-ellipse-1
  (hshift-drawing
   15
   (vshift-drawing
    20
    (drawing-scale 1.25 purple-ellipse))))

black-circle-1

purple-ellipse-1
In fact, we might even combine an image with its variant.

(drawing-group black-circle black-circle-1)

(drawing-group purple-ellipse purple-ellipse-1)
However, we've written very similar code to define
black-circle-1 and purple-ellipse-1. We
would certainly benefit from combining the code into a single procedure.
(define variant-1
  (lambda (drawing)
    (hshift-drawing
     15
     (vshift-drawing
      20
      (scale-drawing 1.1 drawing)))))
This brand new procedure can now be called as it were a built-in procedure. For example,

(variant-1 blue-i)

(variant-1 red-eye)
Pairing an image with its variant is even easier. We just build an image group of the image and its variant.
(define variant-pair-1
  (lambda (drawing)
    (drawing-group drawing (variant-1 drawing))))

(variant-pair-1 blue-i)

(variant-pair-1 red-eye)
Adding Neighbors
One potential deficiency of variant-1pair-variant-1(
gives the width of a drawing and
drawing-width drawing)(
gives its height.
drawing-height drawing)
To make a right neighbor to a drawing, we could simply make a copy of the drawing that is is offset horizontally the width of the first drawing.
(define add-right-neighbor
  (lambda (drawing)
    (drawing-group drawing
                   (hshift-drawing (drawing-width drawing)
                                   drawing))))

(add-right-neighbor purple-ellipse)

(add-right-neighbor blue-i)
Self Checks
Check 1: Building a Drawing
a. Starting with the unit circle, create a circle of radius 50
and name that circle d1. Leave the circle black and filled.
Put your definition of this circle in the definitions pane.
(define d1 (scale-drawing 100 drawing-unit-circle))
b. Display your drawing with the following instruction, which you enter in the interactions pane.
>(image-show (drawing->image d1 100 50))
c. Look at the underlying representation of your circle by asking
the Scheme interpreter for the value of d1.
>d1
d. Create a new drawing, named d2, by coloring
d1 red.
(define d2 (___-drawing "red" d1))
e. Display the new drawing to see that you created it successfully.
>(image-show (drawing->image d2 100 50))
f. Create a new drawing, named d3, by shifting
d2 right 100 units.
(define d3 (___-drawing ___ d2))
g. Display the new drawing to see that you created it successfully.
>(image-show (drawing->image d3 100 50))
h. Look at the value of d3. Do your best to explain each
of the parts of that value.
>d3
i. Create a new drawing, named d4, by grouping
d1 and d3.
(define d4 (drawing-___ d1 d3))
j. Display the new drawing to see that you created it successfully.
>(image-show (drawing->image d4 100 50))
k. Create a new drawing, named d5, by shifting
d4 upward 10 units.
(define d5 (___-drawing ___ d4))
l. Display the new drawing to see that you created it successfully.
>(image-show (drawing->image d5 100 50))
m. Create a new drawing, named d6, by recoloring
d5 to yellow.
(define d6 (___-drawing ___ ___)
n. Display the new drawing to see that you created it successfully.
>(image-show (drawing->image d6 100 50))
o. Create a new drawing, named d7, by grouping
d4 and d6.
(define d7 (drawing-___ ___ ___))
p. Display the new drawing to see that you created it successfully.
>(image-show (drawing->image d7 100 50))
q. What do you predict will be the effect on d7 if you replace the
definition of d1 by the following?
(define d1 (scale-drawing 40 drawing-unit-square))
r. Check your answer experimentally. (Make sure that you click before executing the following instruction.)
>(image-show (drawing->image d7 100 50))
Check 2: Active Reading
a. Verify that the four basic values look as they are described in the corresponding reading.
>(image-show (drawing->image black-circle 200 100))>(image-show (drawing->image purple-ellipse 200 100))>(image-show (drawing->image blue-i 200 100))>(image-show (drawing->image red-eye 200 100))
b. Try some of the transformers. For example,
>(image-show (drawing->image (variant-1 black-circle) 200 100))>(image-show (drawing->image (variant-1 (variant-1 black-circle)) 200 100))>(image-show (drawing->image (add-right-neighbor red-eye) 200 100))
c. Try the my-circle
>(image-show (drawing->image (my-circle ___ ___ ___) 200 100))